Dashboard
The Dashboard is the first page you see after logging in, if you have the HR or ADMIN role (see Roles & Permissions). This page explains what's on it and how to read it. For a short introduction, see Dashboard — Overview.
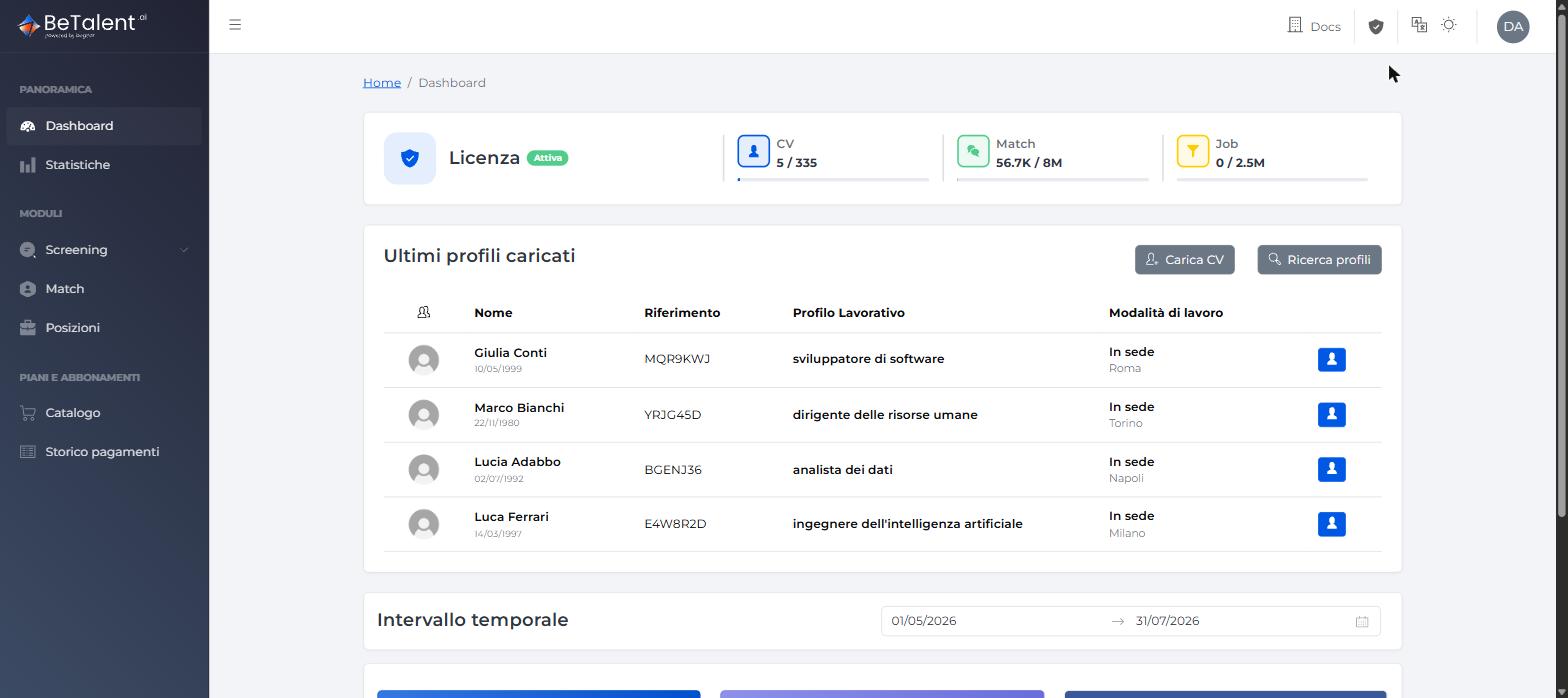
What you'll see
- License — your tenant's active license (package, validity dates, status), the modules it enables, and a Profiles to load quota bar showing how many CVs you can still upload on your current package before hitting the overflow limit.
- Last User Upload — the most recently uploaded candidate profiles. This list always shows the latest activity, regardless of the date range you select below.
- Upload CV — button that starts the CV upload flow.
- Profile search — button that opens candidate search.
- Time range — start date / end date selector, used by the charts below.
- Trend cards for registered users and profiles, plus an upload summary showing uploaded CVs vs. CVs processed with success.
If you land on this page with a role other than HR or ADMIN, you won't see it — you'll get an access-denied message instead.
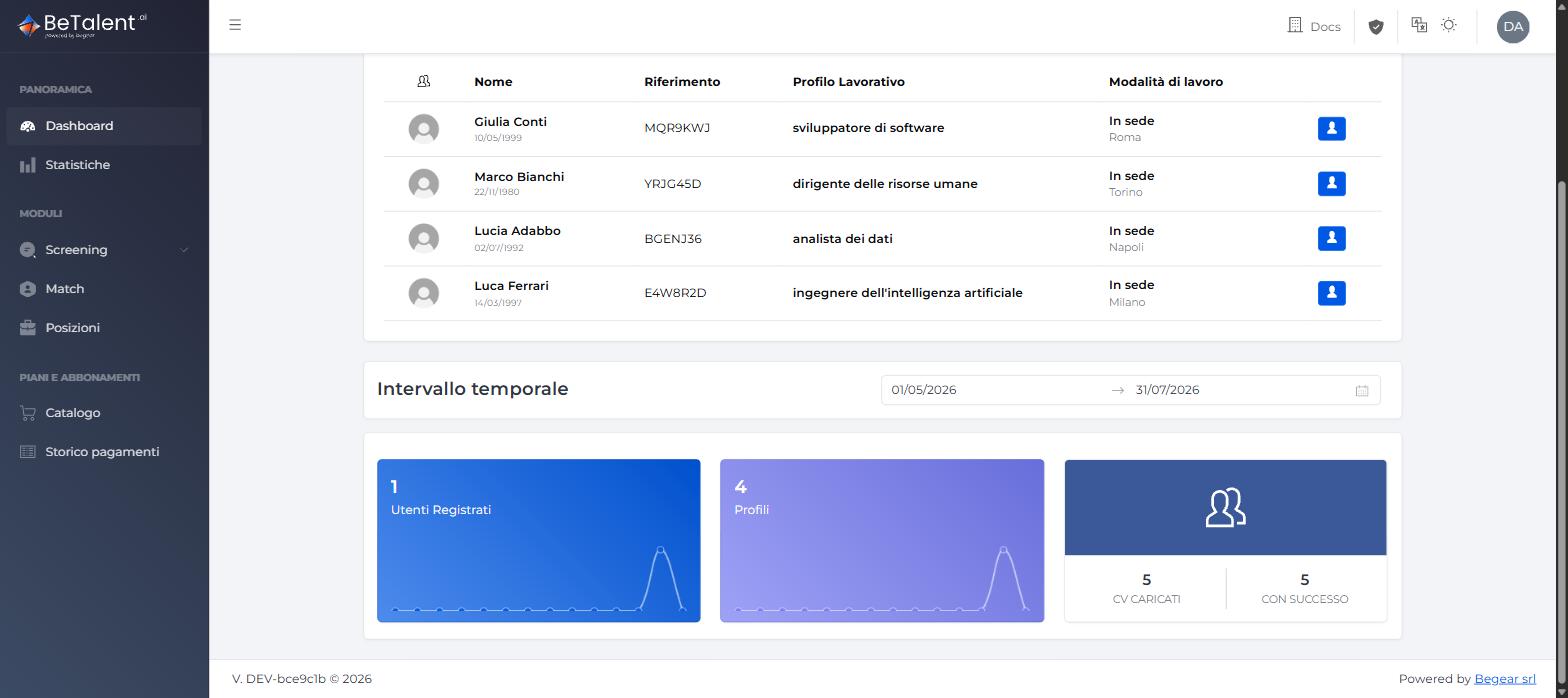
Using the time range filter
Pick a start and end date to update the trend cards at once (it doesn't affect "Last User Upload"). If you don't pick a range, the Dashboard defaults to the last 90 days.
The charts are designed to automatically switch granularity depending on how wide a range you pick:
- 1–14 days — one data point per day
- 15–90 days — one data point per week (a partial week at either end is still shown as a full week)
- 90+ days — one data point per month
If there's no data for the range you picked, the page still displays normally — you won't see errors, just cards and charts with nothing to show (as in the screenshots above, taken from a freshly-provisioned trial tenant).
Related
- Statistics — for a deeper breakdown of the same data.
- Job Position — where "Profile search" and candidate association happen.
- Roles & Permissions — what sets HR apart from ADMIN on the platform.