Statistics
The Statistics page, available to HR and ADMIN users (see Roles & Permissions), gives you a deeper, more detailed breakdown of your platform's data than the Dashboard. For a short introduction, see Statistics — Overview.
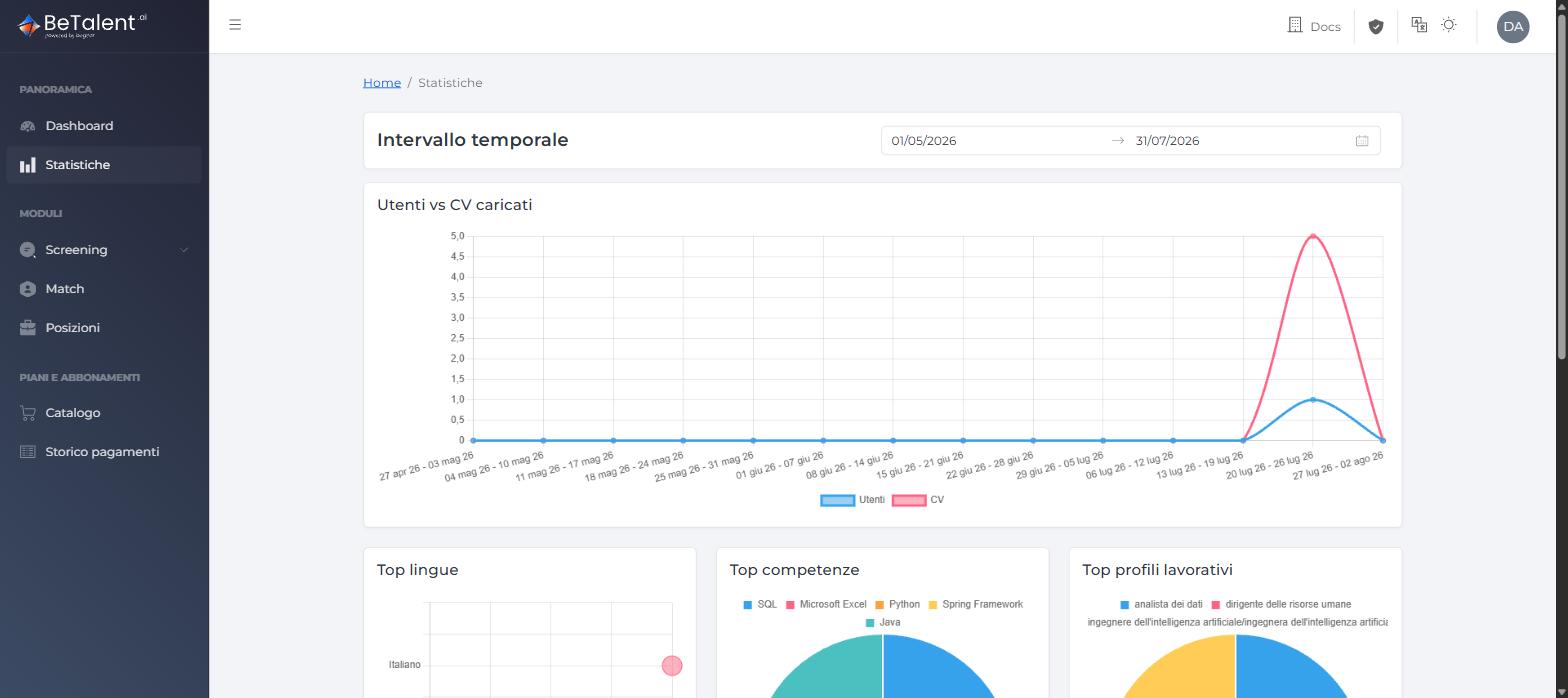
What you'll see
- A time range selector (start / end date) that drives every chart on the page.
- A "Users vs loaded CV" line chart, comparing registered users against uploaded CVs over time.
- Breakdown cards: Top languages, Top skills, Top job profiles, Education, Work mode, and Age.
The screenshot above is from a freshly-provisioned trial tenant, so every breakdown card shows "No data found" — once candidates and CVs exist, these render as comparative charts (distributions and top-5 rankings).
Using the time range filter
If you don't pick a range, the page defaults to the last 90 days — the active range is always shown in the selector. Changing the range updates every chart at once; none of them will show data from outside the selected period. If a range has no data, the affected cards show "No data found" rather than an error, exactly as in the screenshot above.
The breakdown categories (education levels, age brackets, work modes) follow the platform's fixed taxonomies, so figures stay comparable across periods.
Related
- Dashboard — for a quick, high-level summary instead.
- Roles & Permissions — what sets HR apart from ADMIN on the platform.